For a start a critical Planning Example:
Let us assume you are a global electronics manufacturer selling Notebooks in two regions: Europe and Asia.
- Both regions sell almost identical products but “compete” with regional targets.
- The company’s overall “profit maximizing strategy” is well communicated.
- Regional targets are somehow contradictionary and the teams do have culturally based different views on how to compete and might see regionally driven targets as more important.
- A global S&OP is not yet implemented, even though regional alignment is already available and global situations are aligned on C-Suite levels and partly also through certain connections on Director levels or even below.
The Market-Situation:
- Your company faces downward-sloping demand curves, while pricing is effected and some production teams are aware of the fact, that this seems to be a function of total quantity produced.
- We further assume demand volumes will have impact on Sales price development for both friendly ‘competing’ Sales Units globally.
Initial Data:
- Europe production: 1 million units
- Asia production: 1.2 million units
- Total production: 2.2 million units
- Global demand curve: P = 1000 – 0.2Q (where P is price and Q is quantity)
- Production cost per unit: $300
What happens next?
- We assume that each sales region decides independently – without knowing of the other’s demand – the quantity of their products to be produced for the coming weeks or months.
- We might assume that the total demand for your products is changing for the next three planning circle; with strong impact on the production facilities and supply partners:
- Europe increases production to 1.2 million units
- Asia maintains 1.2 million units
- Total production: 2.4 million units
- Resulting price: 1000 – 0.2(2.4 million) = $520 per unit
- Profit per unit: $520 – $300 = $220
- Total profit: 2.4 million × $220 = $528 million
To fulfill the overall “profit maximizing strategy” through a global S&OP:
- The global S&OP team becomes a Controlling-Team, used simply to create theoretical planning models like introduced by French economist Antoine Augustin Cournot in 1838 or by John Nash in 1949 to solve for equilibrium in non-cooperative games.
Their proposal could be this one:
- Europe reduces production to 0.9 million units
- Asia reduces production to 1.1 million units
- Total production: 2 million units
- Resulting price: 1000 – 0.2(2 million) = $600 per unit
- Profit per unit: $600 – $300 = $300
- Total profit: 2 million × $300 = $600 million
Takeaways / Learning effect
- Interdependence of decisions: Actions in one market affect outcomes in others, highlighting the need for global coordination.
- Symbiotic collaboration between regions can lead to a more profitable equilibrium, but best decisions are those that create further competive advantages, not directly available in simple data/science and ERP calculations. – It might be a “win-win”, when teams do not become only believers in simple data and not into the cultural essence of selling under certain market circumstances: They will probably find out, that there is much more to gain from each other than being a team build on profit and data.
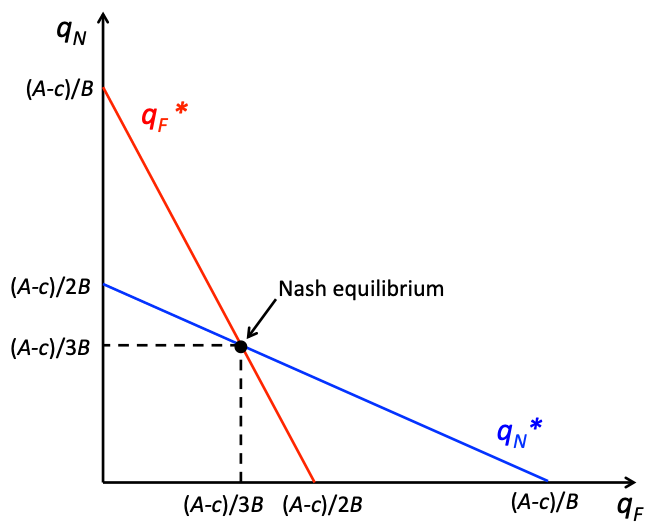
Annex:
Graphical illustrations for a Nash equilibrium, which is in correspondence of best response functions, which is the same as a crossing of the reaction curves.
Media Attributions
- 18.1.1 © Patrick M. Emerson is licensed under a CC BY-NC-SA (Attribution NonCommercial ShareAlike) license